Data & AI for Media: How would you describe the skills makeup and scope of your data team?
Holmen: Our data team underpins the company, since Bibblio’s value is derived entirely on data. The key team members are our Head of Product, Nic Young, and Lead Data Scientist, Dr. Mahbub Gani, who both have extensive experience with semantic data and machine learning from previous roles and lectureships. His main role is leading our research and implementation of the recommender systems algorithms that power Bibblio’s SaaS service.
Data & AI for Media: What are the most important components of your data and AI strategy?
Holmen: As a company that’s built on using AI in conjunction with content and data from customers to deliver value for them, everything is essentially data and AI strategy to us. It’s probably fair to reframe this slightly and look at how we’re an important component of our clients’ overall data and AI strategy. We help media companies increase the value they get from their content and visitors by finding connections between content and user behaviour to power engaging recommendations and drive better economic outcomes. At the same time we allow them to simplify their own technology stack by delivering this as a service.
Data & AI for Media: How is data used to drive revenue?
Holmen: AI applied to the data we have about our clients’ content, audiences and site interactions is what allows us to create engaging recommendations that clients want to pay for, so without intelligently analysed data there wouldn’t be a Bibblio. We also generate data for media companies in the form of contextualised information about their visitors’ interactions with our recommendations.
Data & AI for Media: If you were advising other data directors on how to build their operations, what key lessons would you impart?
Holmen: Think outcome and business case first, not technology and algorithms.A large part of getting value from data is about making sure it’s the correct data, in a form that’s actually useful to you. Also, look for commoditization when possible and take the easiest route to results. You don’t need to build or re-invent natural language processing to benefit from it – and the simplest, well-proven, algorithms are often the most effective.
Data & AI for Media: How does audience data factor into product development and improvements at Bibblio?
Holmen: Audience data is everything to us: without it we can’t understand the reaction of clients’ visitors to our recommendations, so we’re always incorporating insights from audience data into how we evaluate and develop the product.
Data & AI for Media: In your opinion, what does the future hold for the business use of data and artificial intelligence in media?
Holmen: Nowadays it’s essential for media companies to understand their audiences; otherwise they can’t build the content, trust and relationships that create loyalty and revenue going forward. To YouTube, Netflix, Facebook and Spotify recommender systems are responsible for +80% of all engagement time. AI is crucial to that task, because it’s by far the best scalable way to make better predictive models for each individual user; in fact that’s essentially all that these algorithms are doing. Even with regulatory roadblocks like GDPR and concerns around filter bubbles and fake news, data and AI are going to be one of the essential pillars on which media businesses rest in the future. We just have to learn to harness it well, not blindly run away or embrace it. Either can be disastrous in their own right.
Data & AI for Media: How would you describe the skill makeup and scope of your data team?
Govik: Mittmedia’s data team is organized around the different types of data used as the backbone of the digital organization. This means that we have competences within the group to ensure that the team autonomously can work within the scope of collecting, processing and extracting user-, content-, interaction- and advertising data. To be able to do this we have devops, machine learning experts and data scientists working together.
Data & AI for Media: What are the most important components of your data and AI strategy?
Govik: The most important component of Mittmedia’s data strategy is the demographic and behavioral modeling of our user base. To stay innovative we must understand what values the users find in our products, and why they chose to engage with us in the ways they do. Being able to simulate and predict user behavior is a core part of data science processes with the purpose of driving business development.
Data & AI for Media: How is audience data used to drive advertising and subscription revenue?
Govik: Audience data is deeply integrated into our products and processes. As an example: We use audience data to present a personalized selection of what stories to display to the users. In the same way, we also use audience data to build target groups for advertisers.
Of course, we use audience data to build insights that editors and product managers can use to make better content and better products.
Data & AI for Media: If you were advising other data directors on how to build their operations, what key lessons would you impart?
Govik: Mittmedia’s key advice in regards to implementing a data platform is to formulate a few easy to follow data policies, and then stick to them throughout the development process. The most important part of building large data products is to keep the purpose front and center in all discussions.
Data & AI for Media: How does audience data factor into product development and improvements at Mittmedia?
Govik: It’s something that is ever present in product development. As an example: When we are building new features in a product we almost always start with an experiment with the only purpose of gathering audience data in order to make a data-informed decision.
Data & AI for Media: In your opinion, what does the future hold for the business use of data and artificial intelligence in media?
Govik: The editorial products that we see today are, with very few exceptions, built upon the same strategy as the printed newspapers. It’s the same selection for everyone. We haven’t really taken advantage of the possibilities of data. With the help of data, we can improve the content relevancy for our users.
Alan Segal is VP for Audience and Analytics at CNN Digital in the United States. VP, Audience Development & Analytics. He will speak at the 8th Data & AI for Media conference in London about how CNN Digital leverages data and AI to understand its audience and drive advertising revenue.
How would you describe the skills makeup and scope of your data team?
We have a combination of computer science and analyst skills on the team. We need to run the gamut because data/computer scientists have the ability to go deep, but they aren’t subject matter experts around the business needs. By pairing the two groups together, we find we are able to accomplish more.
What are the most important components of your data and AI strategy?
Given the size of our team, it’s critical we work on problems that either lead to important insights about our audience or how we can work smarter.
How is audience data used to drive advertising and subscription revenue?
We are heavily focused on our ad supported business. We use our data to improve our understanding of the audience. This in turn drives product changes, workflow changes, and strengthens our relationships with the audience.
If you were advising other data directors on how to build their operations, what key lessons would you impart?
It feels as if everyone wants to jump to the data science component of the solution, but there are so many things to get right first. Is your data available for use? Is it clean? Can it be manipulated? Do you have a way to inject your understandings into your products? Data scientists are a critical piece of the puzzle, but it requires a much larger cast to make meaningful progress.
How does audience data factor into product development and improvements at CNN?
Audience data is instrumental in so many ways, but perhaps the simplest is through A/B testing. The importance of understanding how the audience reacts to a product change – both the change itself and its downstream implications – cannot be overstated. Another area of great importance from a product perspective is understanding which cohorts to develop features for. Obviously, not all users of our products are the same and their impact on consumption is equally varied. It’s a thorny multivariate problem that has to balance user and business needs, but is impossible without our growing trove of audience data.
In your opinion, what does the future hold for the business use of data and artificial intelligence in media?
Truthfully, I think the media industry is still at the beginning of the data and AI journey. We’ll look back in 5-10 years and marvel at how far we’ve come around improvements to both the user experience and the business models needed to support it.
Tor Jacobsen is SVP Consumer Marketing & Revenue at Schibsted Media. He will speak at the 8th Data & AI for Media conference in London about how Schibsted leverages data and AI to acquire and retain subscribers.
Data & AI for Media: How would you describe the skills makeup and scope of your data team?
Jacobsen: Schibsted’s data and analytic capabilities are primarily located close to the market and the brands. Data competences, primarily focusing at behavioral data, is paired with research, insight and business expertise to ensure that it drives actual business value. The output from the data can both be data driven products and decision support.
Data & AI for Media: What are the most important components of your data and AI strategy?
Jacobsen: The core of the Schibsted’s strategy is to minimize number of weak links in the processes of refining the raw data into insights and actionable conclusions. The data and analytics is seen as a crucial component in the vast majority of the core processes of Editorial and Consumer Business rather than a standalone function.
To ensure rapid development and high focus at business application a scalable data architecture will be crucial. Machine learning, AI, is a common component already used in various predictive models. However, developing the methodology itself is not in focus but the applications are.
Data & AI for Media: How is audience data used to drive advertising and subscription revenue?
Jacobsen: We use audience data for several purposes such as statistical modelling, content optimization, pricing (both B2C and B2B), segmentation, optimization of customer service etc. The overall objective is to provide our users and customers with relevant and personal(ized) experiences through fully data driven products.
If you were advising other data directors on how to build their operations, what key lessons would you impart?
Clean up your data structure. You need high quality data you can trust
Focus at application and do not dive too deep into fancy techniques
Make sure your data and analytics team is close to core business. It is much harder to succeed if you have a highly specialized team disconnected from the people producing output (content) and/or doing marketing activities
Build data and analytics’ competences in your management team and/or management level
Minimize time spent in number logistics and try to automate recurring tasks
Make sure you have the right people and competences. Recruit new competences if necessary
Data & AI for Media: How does audience data factor into product development and improvements at Schibsted?
Jacobsen: We use audience data to identify new opportunities and optimize core processes across most of our business. How we do this varies from project to project and process to process. I believe this is more a of a mindset question: We need to make informed decisions. Looking at audience data is a very easy way of working data informed.
Data & AI for Media: In your opinion, what does the future hold for the business use of data and artificial intelligence in media?
Jacobsen: I believe data and AI will continue to be extremely important going forward. Our first experiences with algorithms running our front pages, optimizing advertising sales and improving how our products work are mostly positive. We believe that a combination of human creativity and smarter technology will help boost our business going forward. A higher degree of machine learning in our processes doesn’t have to imply less human interaction. Human creativity and fingertip feel can be enhanced with well design decisions support.
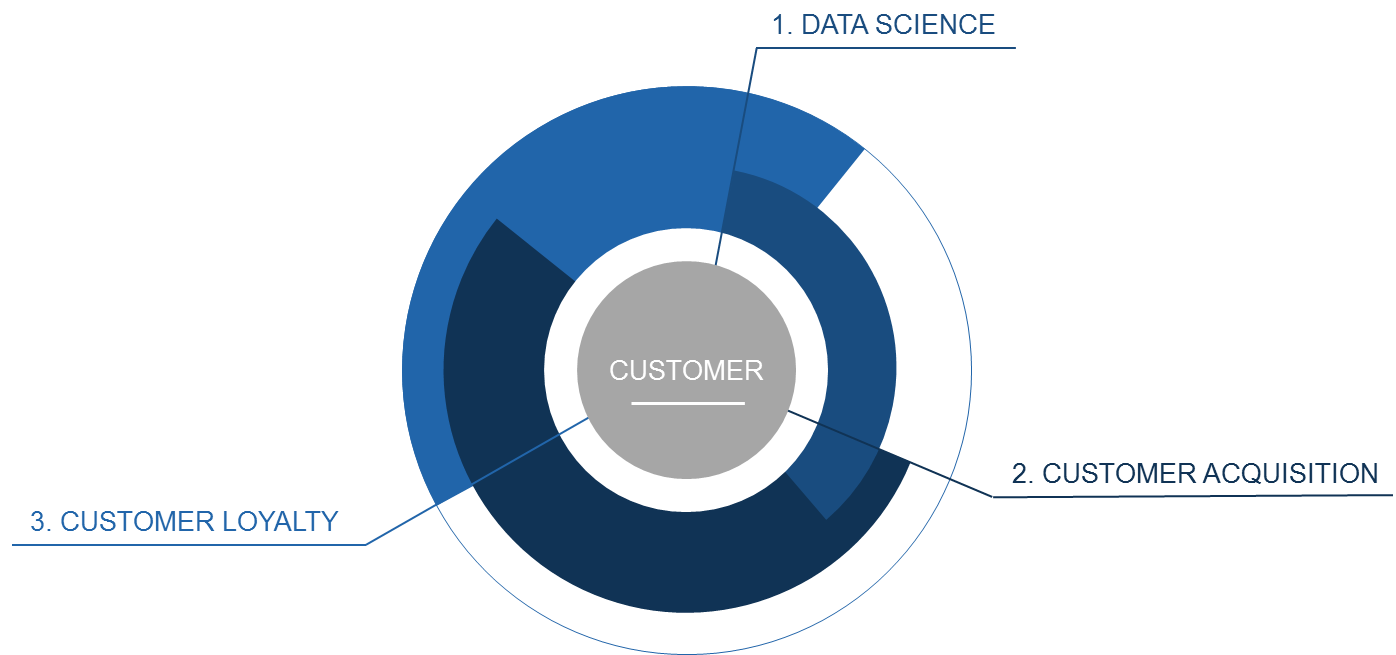
Styria Marketing Services (hereinafter referred to as SMS) is part of Styria Media Group AG and as internal service provider responsible for personal contact with customers such as readers, (digital) users and subscribers. Styria’s top brands like “Kleine Zeitung”, “Die Presse”, “Wienerin”, “miss”, “Diva”, “Sportsmagazin” and “Top-Times” (hereinafter referred to as brands) trust in the services of SMS. We cluster them in three main domains:
2. Define the Problem
Although a lot of media companies were already facing digitalization for quite some time, with daily newspapers leading the way, the area of customer acquisition was often left out from the digital transformation. SMS addressed this neglect. In order to establish data-driven marketing for Styria, we built a data unit around our CRM system as central data pool and established Big-Data practices in customer acquisition.
In the years prior to this project, the 2013 implemented CRM system has already been successfully in use as central data tool and provided a platform for user, readers and subscribers related activities for Styria’s brands.
The next consequent step was the question how to further use the gathered data and in what ways marketing benefits from (Big-) Data. Since we think the right answer to this question is to make the right data available for use, SMS started a profound program for change to improve customer acquisition using data-driven marketing services. The following four main goals were defined:
Identify each touchpoint a customer has with one of Styria’s brands through collecting data in a comprehensive way
Pool and utilize the gathered information in a central system (i.e. the central B2C-CRM run by SMS)
Establishing a base for data-driven marketing services and make these services available to Styria’s brands
Introduce data-science to the company in order to further professionalize marketing and to establish data-science as new domain of SMS’ business activities
Further goals were the reduction of scattering losses through a shift in our customer acquisition activities, from a broad target-group based approach to a “Single View of Customer” and to enable key user of our brands to perform professional data-driven marketing campaigns.
3. Planning and rollout
To ensure agile tasks handling and flexible coordination between teams working on the project in different paces, the project was separated into the following steps:
Analysis & Strategy (Q4/2014) A companywide location of the various different data pools, sources and touchpoints between customers and our brands and further categorization in regards to size, complexity, structure and rhythm of dataflow.
Creating a central database and implement Big Data (Q1/2015 – ongoing) Each data source was addressed and interfaces between these sources, the brand’s touchpoints and the CRM were established. Excluded data silos were integrated and dataflow was centralized.
From Big Data to Smart Data (Q1/2015 – ongoing) Through our ever growing database the need of simplifying collected information arose. During the process we call “Smart Data” our data scientist cluster and refines relevant information through implementing algorithms and using scoring and profiling in order to make the data tangible for targeted use. Further, SMS’ experts support Styria’s brands in selecting and applying data in marketing activities.
Single View of Customer (Q3/2017 – ongoing) With the usage of AI, a Recommendation Engine was developed. It combines various sources of data throughout the company and supports our brands and shops through displaying (real-time) content based on a customer’s preferences.More generally, the development of this engine can be considered the cornerstone for the continuous ongoing progress into the direction of a “Single View of Customer”. Through creating intelligent data pools, which are able to handle both structured and unstructured data, and the growing usage of AI (in combination with human employees) we want to further push data-science in customer acquisition to gain an individual understanding of each of our users.
4. Resources
The project was realized mainly with resources from within the SMS, however for some sub projects, we consulted internal and external partners. Within SMS additional employees were hired, for the projects implementation as well as in the data-science unit.
The newly formed Big-Data-Unit “X-Data” was responsible for the coordination of the project’s steps 2 to 4. The unit offers data-driven services for Styria’s brands (as described in Section 5. Project’s progress).
Additional employees for data-science were hired. Their task is it to refine and simplify the data as well as the development of the customer scoring as a feature for our marketers.
Technology wise resources:
SAP: The CRM as central data base is an SAP System, the algorithms implemented by our data scientist are written within this system.
SPSS: In order to identify potential new customers, based on their interaction with Styria’s services, we developed an individual scoring using SPSS. This enables us to act out specific customer acquisition activities based how likely one will become a customer. This scoring is currently used in customer service too (i.e. how likely will a customer terminate his subscription).
Recommendation Engine: In cooperation with “Styria Media Service Croatia”, we developed an engine that derives personalized recommendations for one of our brands’ online-shop customers. Using data such as past purchases, preferences in products derived from clicks in prior newsletters and online-shop visits as well as cross-sectional socio-demographic information, single-customer fitted newsletters are generated automatically. The therefor implemented algorithms apply collaborative filtering as well as matrix factorization as tools to merge and analyze the given data.
Data Lake: Currently we are in the midst of creating a data lake in order to kick-start our next development stage, which is to be able to link different kind of data sources and to support our single customer’s whole journey even more.
5. Project’s Progress and Success?
As a consequence of our efforts, we are now able to offer entirely new services for Styria’s brands such as data-science in general, data-driven marketing campaigns, customer scorings etc. These services allow their users to perform more target-group specific campaigns up to single customers focused activities, which consequently improved customer acquisition since their start as well as customer retention. Further, the structured handling and analysis of our vast amount of data enabled us to spot potential for up- and cross selling for our brand’s products.
Through not limiting these new services solely to internal brands but offering them also to Styria-external customers, we were able generate an additional 6-figure revenue stream in 2017. Following, some more examples for our projects progress and success are given:
After 2 years of service, more than 150 to 200 data-driven marketing campaigns p.a. were already performed
Customer retention activities are up to 27% more successful thanks to preciseselection based on data
Through new data-driven services, CRM’s use grew by approx. 30% p.a.
Since the start our project in 2014, we successfully supported our two main brand to hold paid circulation on a constant level
Acquisition scores proofed their value as conversion rates were significantly higher than in the test-groups. (i.e.: campaigns to reactivate inactive customers performed 8% basis points better than those without scoring).
6. Challenges
User Integration: “Data-driven marketing means cultural change”. One of the biggest challenges throughout the project was not to overwhelm users with the newly implemented digital services and to avoid the users’ rejection, caused by breaking old habits. Services needed to be understandable and released in smaller cluster easier to handle. Users were offered trainings and support to familiarize them with the application. Furthermore, consequent management on all levels and constant open and honest communication through all steps of the project was required to face this challenge.
GDPR: As a consequence of the recently adopted General Data Protection Regulation, we aligned our Big-Data-Affords with the new legal environment. Since we are held to check legal conformity of our data-driven practices on a regular basis, this will be an ongoing challenge in the future, which has and will require adjustments to meet given regulations.
7. Future goals and long-term issues
Based on our CRM system and data-science efforts, first AI-applications (e.g. recommendation engine) are in use. Our future objective is it to further develop our data-science unit and to increase AI’s use, not only in customer acquisition and marketing activities but also in other business areas of SMS and its brands. Artificial Intelligence will be applied to determine our users’ individual decision making reasons and to derive personalized offer and services from it.
Naturally, the expansion of our data pools and improved utilizations of data are requirements for future development. There is an increased importance of handling not only structured but also unstructured data in order to harness the rapidly growing sources of information. Especially the integration of (written) customer feedback and its analysis will play a crucial role in our long-term Big-Data strategy.
Currently we are working towards the objective of optimizing our brands’ digital value chain. This involves accompanying and guiding users from “unknown” through various stages up to “digital subscriber”, with the aid of different data-driven tools and (self-) services. Generally, our data-driven activities long term effort is it to establish a profound bond between users and Styria’s brands.
Additionally, the further technological and digital training and support of the project’s stakeholders (i.e. key users, employees, brand units etc.) is an important factor for future development.
Converting visitors on news sites to paying customers is today the focus of media houses around the world. By opening up a new digital revenue stream, alongside advertising, total digital revenue can increase. But that requires content that makes readers log in to the site and – preferably – become paying, recurring customers.
News about real estate business have a proven high reading among local newspaper readers and visitors to local media sites. Analyzes of how the content is used now also shows that real estate business news appeals to loyal, often paying visitors. (In addition, they are pure click magnets!) At the same time, it appears that almost no such texts are published on the local media site. (Case: MittMedia, Sweden)
The housing market has long been an important advertising category for the daily newspapers. Online, the media houses have had a hard time creating a relevant environment for offers from real estate agents. With a flow of automated real estate texts, such an environment can be created.
Bring real estate listings into the Internet age!
By automatically produce a unique text for every house sold, with images, maps and geographical data, we bring the old listings into the internet age. (United Robots operates in the same way withs sports results, stock market listings and new companies and bankruptcies.) Not only does the number of texts about real estate deals increase dramatically, in addition, the following happens:
We automatically finds and attaches to the text a high resolution Google Street View image, a satellite image and a map with coordinates.
Now also smaller news sites can launch their own property sites, as the automated real estate texts allow a constant flow of new content. (For a normal Swedish news site that means about 20 articles per weekday.)
Each property sale gets its own URL, which dramatically increases the number of pageviews.
Real estate texts have proven ability to convert readers to paying subscribers.
Interested in testing personalization or superlocal apps? This requires super-local materials, such as real estate sales. And it is a highly relevant content for readers in local communities.
When our smart algorithms find information that might be worth paying extra attention to, an Alert will be sent to the newsroom. For example when the most expensive property so far this year was sold, or the largest, or when the highest square meter price in an area was recorded, etc.
We analyze and compile – completely automatically
But there is more to gain from using United Robot’s analysis and natural language platform.
All property sales in a particular area (such as a county or municipality) are stored in our database and analyzed over time. Our platform keeps track of average prices, price trends, the most expensive hoses sold in the area and much more.
Fully automatically, our algorithms write an unlimited amount of summary texts and list the most expensive deals – a dull and time-consuming job, currently performed manually in most newsrooms.
List: The most expensive villas in Övikstrakten right now
The house prices in Övikstrakten continue to decline. Last month, prices fell by seven percent.
Four municipalities have downward curves. For example, prices fell by 14 percent in Härnösand and 12 percent in Kramfors. The average price for a villa in the region is SEK 830,000.
Here are the most expensive houses sold in Övikstrakten in the last month:
• Sjöbodvägen 141, SEK 4 000 000:-
• Mesanvägen 23, SEK 3 530 000:-
• Brunnshusgatan 34, SEK 3 000 000:-
• Frejgatan 53, SEK 2 950 000:-
• Blåhakevägen 21, SEK 2 950 000:-
• Hummelviksstrand 138, SEK 2 800 000:-
• Andra Långgatan 11, SEK 2 600 000:-
• Ulvö Hamngata 212, SEK 2 355 000:-
• Lövvik 202, SEK 2 350 000:-
• Klippvägen 14, SEK 2 325 000:-
Automatisk text från United Robots
Data source and method
The Swedish Mapping, Cadastral and Land Registration Authority registers changes of real estate ownership in Sweden. Similar authorities exist in most countries.
United Robots receives from the Authority about 500 data posts about changes in real estate ownership daily. The data is stored and analysed, to find the most relevant angle for a story about every property deal that happened in the country last day. After that United Robots Natural Language Generation plattform turns those findings into a finished text, an publishes it immediately to our customers news sites.
In addition to the text, we also use Machine Learning software to find the most relevant high resolution Street View pictures from Google, as well as a map and a satellite picture. Geo coordinates are also added.
Example of a story written by The Home Owners Bot, from MittMedia in Sweden (translated)
Results
Early measures and analysis shows that the real estate texts generates a massive amount of page views. The big Swedish local news publisher MittMedia has put the texts behind its paywall, and seen them generate hundreds of new paying customers. Another local media house has created a stand alone destination site about home ownership.
For United Robots the Homeowners Bot has been a success, as the four larges local media companies in Sweden has signed up for the service during its first six months.
Enter the 2018 BIGGIES EMEA competition, with 12 categories focused on Big Data- and AI-driven products and processes at media companies. Deadline is Sept. 7. Enter now!
Why did you build EngageReaders? What is the media industry’s ‘problem to be solved’?
Danny Lein:
Many newsrooms these days are organised in terms of speed: there is the center of a newsroom with an online team, directly connected with its audience and on the other end there is the large team of journalists and editors in charge of the publication of a daily newspaper or weekly magazine.
While the first team work on a stream of news and have extensive insights through analytics, engagement measurement tools and success on social media, the latter team work as they have been working for over a century: completely navigating in the dark on how the audience perceives and engages with their product.
To bridge this gap, we initiated the Digital Reader Engagement project in cooperation with Mediahuis, publisher of 6 newspapers including De Standaard, NRC and De Telegraaf. The goal was to define, measure, and predict engagement of readers with their digital newspaper and to translate those measurements to key insights that can be used in the newspaper production process (both print and digital).
Today, EngageReaders is helping editors learn how to improve the engagement levels of both their print and digital newspaper publications based on scientifically grounded insights. Currently it is used in 10 newsrooms, and improves the engagement of editions such as Le Monde, Ouest-France, Aachener Zeitung, Berliner Zeitung, and many more.
Big Data & AI for Media:
What are the time frame and milestones for EngageReaders?
Danny Lein:
EngageReaders was developed in five phases, with the final phase consisting of ongoing improvements.
Phase 1: Scientific Research (2014 – 2015)
We started in November 2014 with a scientific research project in conjunction with the University of Leuven, the innovation hub Imec, and Belgian publisher Mediahuis. We studied panels of readers with sensors, tracking device interaction, posture, pupil movement, heart rate, blood pressure, and asked users for feedback on content. After all this data was gathered, an extensive analysis of all the user reactions and interactions was conducted. Prototype dashboards were developed and tested together with the newsrooms of De Standaard and Het Nieuwsblad.
From this research, the key learning was that time and positive affect are key metrics for understanding reader engagement with digital newspapers. Positive affect is influenced by content, composition, reading comfort and aesthetics of the digital edition.
Phase 2: Product Development (2015-2016)
With the support of Google DNI, we started to develop a Minimum Viable Product (“MVP”). We focused on three areas: measuring reader engagement, measuring and predicting attention time, and measuring positive affect. In close collaboration with the newsrooms of De Standaard and Het Nieuwsblad, we finetuned the prototype dashboards towards production ready tools.
During this process, we ensured that EngageReaders could be made available to any publisher. The technology had to be easily integrated within the apps and websites of publishers, not only in the apps of Twipe. This resulted in an open EngageReaders SDK and API.
Finally, we developed the first predictive model for reader engagement on digital editions. We are able to predict how much time readers will spend on articles, given the length, composition and structure of the publication. This predictive model gives the newsroom deep insight into over- and underperforming articles. It helps in making decisions on investing in content and improving the composition of the daily editions.
Phase 3: Pilot at Het Nieuwsblad (2016)
Toward the end Phase 2, we ran a 4-month pilot with one newspaper from Mediahuis, called Het Nieuwsblad–with a print circulation of close to 300.000 copies, this is one of the largest newspapers in the region. The purpose was to gather feedback on the tools we wanted to develop directly from the newsrooms. We asked the editorial team to integrate it into their daily routines, and then we gathered feedback on the usefulness of the tool. This feedback was integrated in the final version of the dashboards and tools.
Phase 4: Roll Out to Other Newsrooms (2017-2018)
Once the pilot phase was over, we aided Mediahuis in rolling out EngageReaders to additional newspaper titles over the next two quarters.
We launched last year in five newsrooms: Aachener Zeitung (Germany), Het Nieuwsblad (Belgium), De Limburger (The Netherlands), L’Avenir (Belgium), and La Montagne (France). This year we’ve continued to roll out EngageReaders in more newsrooms, including Le Monde, Ouest-France, DuMont, and MediaPrint.
Phase 5: Ongoing Improvements (2017-…)
Since we launched, we continue to make improvements to the product, based on our bi-annual partners meetings, where participating newspapers can discuss and vote on what new features are important to them. We foresee this phase lasting indefinitely so that we can always be improving and adapting EngageReaders to the real needs of its users.
Big Data & AI for Media:
What do the team and resources look like?
Danny Lein:
The team for each phase was slightly different, but for the main development the team was composed of two JavaScript developers, one Android and iOS developer, one big data expert, one data scientist, and one project manager. In addition, during the first phase we worked with researchers from the University of Leuven and Imec using Mediahuis’s newspaper De Standaard as the use case. In the latter phases we worked with the team from Mediahuis as well, with a dedicated Project Manager and Systems Architect, which allowed for a smooth technical integration within their infrastructure.
Our project benefited from co-funding from both Google’s Digital News Initiative and the Flemish government. In total this funding amounted to 1.5 million euro, with additional funding from Twipe and Mediahuis.
Big Data & AI for Media:
What are the challenges you faced?
Danny Lein:
The key challenge we faced was the issue of data aversion within newsrooms. This meant that it was difficult both in the development of the product, when trying to understand what metrics would be most useful, as well as in the implementation phase as there was resistance by some who did not want to have performance measures for their content. We learned that fully integrating any new dashboard into the daily routines in the newsroom takes a long time and requires champions who will push for integration.
While it was important to us that we develop EngageReaders as an SDK that could be integrated in to any ePaper app, this was not an easy process.
When we first started this process in 2014, we made the best possible choices with the technology available on the market. Since then the technology has evolved so rapidly that if we were to start today, we would have many more options to choose from. That is why it has been very important for us to ensure we are able to keep up with all technology changes.
Finally, the eternal difficulty with selling a product that gathers data is making the insights actionable. This may sound like common sense, but it is much easier said than done.
Big Data & AI for Media:
What is the business impact of EngageReaders?
Danny Lein:
One key business impact is that newspapers using EngageReaders have seen a reduction in churn, meaning more readers are staying engaged with the content and not leaving. By placing more engaging articles earlier in the edition, average time spent reading the editions have increased. We’ve also seen that publications with articles that are read longer have higher Net Promoter Scores by 3-5%.
To date, EngageReaders is the only tool in the industry focused purely on editions, using ePapers as a proxy for their print counterparts. This means that EngageReaders is the only tool available for newspapers to get daily insights into how their print product is read as well. We know that how people read digitally and in print are very similar, so newspapers can now take what they’ve learned from their digital edition and use it to improve their print offering as well.
Big Data & AI for Media:
What are the long-term challenges for EngageReaders?
Danny Lein:
Given the very specific niche in which EngageReaders operates, namely edition-based formats, and given the still existing data aversity among the industry, the business growth is moderate but steady. There are many competing analytics tools, however nothing is focused solely on editions. This is on one hand a challenge for us, but also an opportunity for us to grow.
While it has improved slightly, data aversion is still an issue when working with the newsrooms. This means we are pushed to look for further sources of value for EngageReaders, such as personalized reporting, ‘Rate My App’ function for satisfied readers, heatmaps for visual reports, churn reduction tools, custom surveys, and personalized news and notifications. This last feature is part of a new Google DNI project we are working on with a different publisher, called ‘JAMES, your digital butler’.
Big Data & AI for Media:
What are the recommendation you would give publishers in order to be successful with EngageReaders?
Danny Lein:
One key recommendation for success is to find your champions early on. Find the people who believe in the new product and are excited to integrate it into their daily routines, as they will be best suited for changing the minds of the skeptics within the organization.
Finally, since the launch, a group of launch partners have met every six months to share their experiences with this new innovation in reader analytics and to discuss their insights. This has helped to further improve our product offering, as well as allowing the publishers to learn from each other on how to integrate EngageReaders into their daily workflow.
Big Data & AI for Media: Define the problem to be solved or technology disruption to be addressed
Bartek Zarebski: There are three key problems which drove us to create the data-driven process of publishing.
Previous drivers of the digital publishing business growth in Poland stopped working after 15 years, such as: organic growth of reach of the Internet audience, digitalization of the content niches, mastery in content distribution via home page of news service.
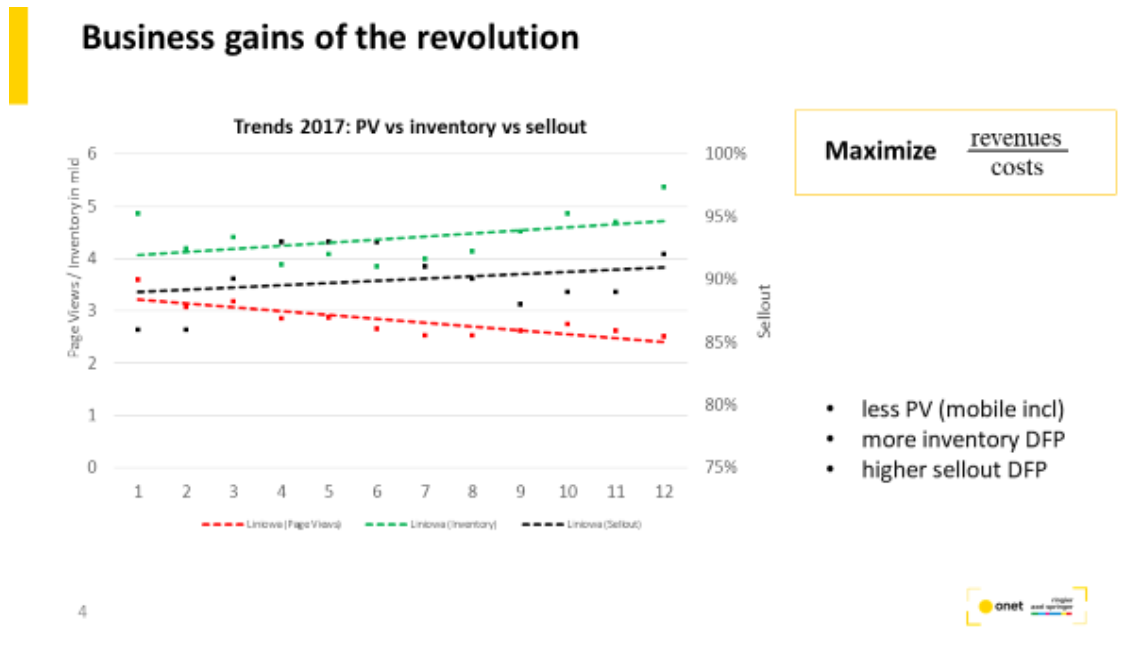
Our traditional model of the business upscaling – the more page views equals the more revenues – failed.
At that time, our publishers produced more page views but we made less in revenues, didn’t know why.
There’s been a change of the clients’ criteria of advertising purchase from quantity of ad inventory to quality of ad inventory becouse of programmatic transparency.
In response to these changes, we have created several solutions by leveraging our data.
Our data-driven solutions are:
We changed the KPIs of the entire value chain delivery
(editorial and product) from page views (PV) to:
IF (inventory factor) – the number of ad queries to adserver, produced by 1PV or video view.
RpQ (revenue per ad query) – metric of effeciency of the produced inventory monetization
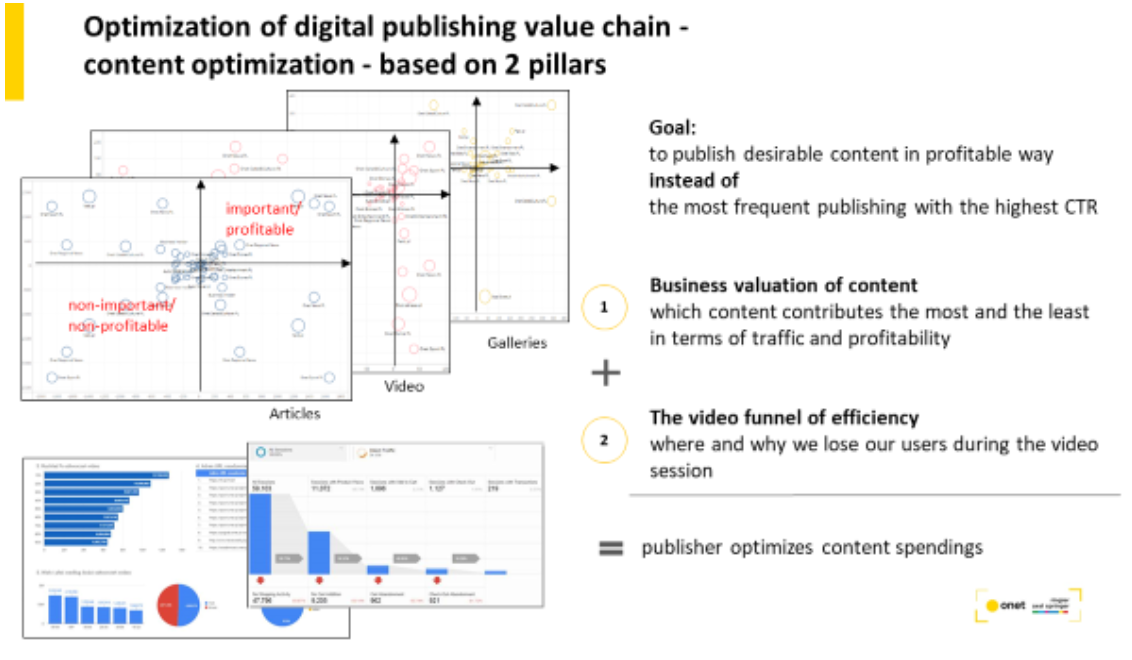
Engaging page views – the number of PV engaging user for more than 5 sec
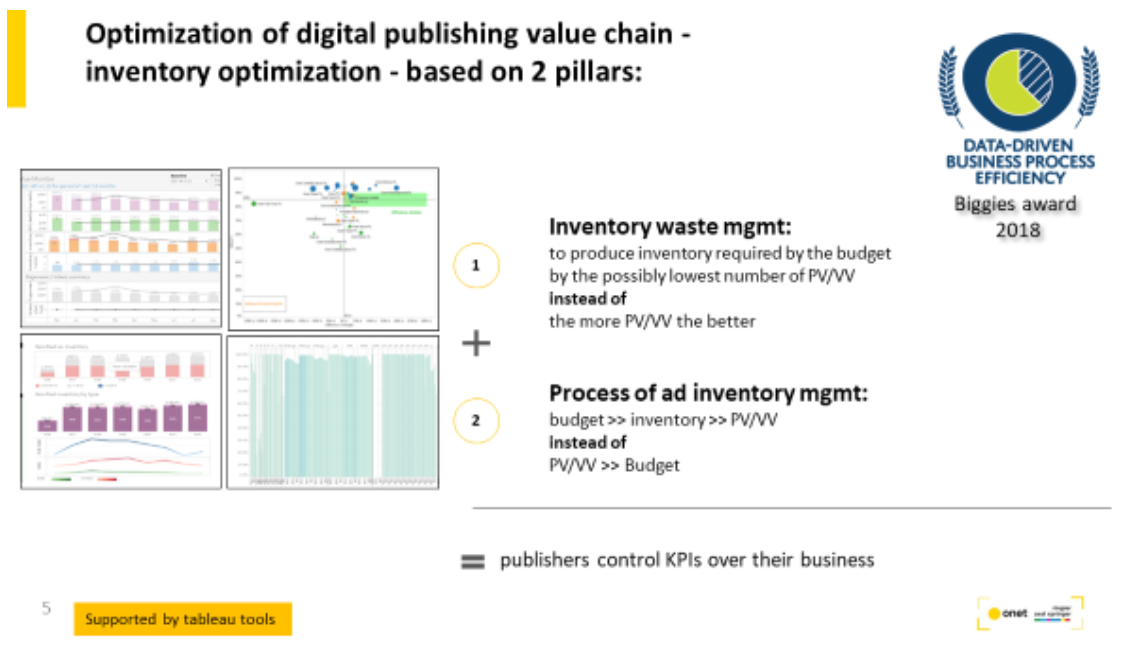
We established process of inventory management with the goal: to produce ad inventory, in amount and quality, required to deliver the assumed budget targets
We deliver to the business predictive analytics in order to find and close the gap between the market potential and potential of ad inventory production, across entire portfolio of brands.
Big Data & AI for Media: What is the time frame for project, and milestones that took place, including details on planning, testing, experiments, rollout, review and improvements.
Bartek Zarebski: The project took 18 months of development, including the following milestones:
Standarization of traffic measurement across entire portflio, including new metrics required by the model of predictive analytics
Standarization of the inventory production (coherent ad stack across entire portfolio)
Agregation of data of traffic measurement system, CMS, CRM, ad servers in one data warehouse
Structurisation of agreagated data to the common for entire portfolio structure, reflecting profit centers, types of content, distribution, ad market
Value chain mapping – based on data, description of business relations among: content>traffic>inventory>revenues
Development of tools supporting insights for business, editorial and product in order to delivery new KPIs (above)
Of the 18 months of development, we took six months to implement the changes, including:
Editorial teams training
Plan of product development supporting new goals
The budget adjustment according to real potential of ad inventory production
Launch of the inventory mgmt process in entire portfolio at once
Monthly revisions of gap between the budget assumptions and potential of the inventory production
Risk management – how to close the gap
Big Data & AI for Media: Please describe of the resources used for the project, including budget, technologies, team members, skill sets and time spent
Bartek Zarebski: We used the following technologies for these projects:
Hadoop, Tableau, private cloud
(meantime decision of migration to public cloud has been made)
Internal system of measurement of all required events and its metadata
Domain systems as sources of data:
– DFP + homemade, native ads, adserver
– Homemade CMS
– Customized CRM Update10
– SAP
All of these newly implemented technologies required us to cultivate new skills, including deep knowledge on how adservers transform traffic into ad inventory and for what purposes. We also needed to add several highly skilled people, including a big data architect, data flow architect, business data architect, analysts, business process engineer, software developers.
In paralel, about 15-25 people worked on the project in different configuration of teams and skills, depending on the project’s stage.
Big Data & AI for Media: Please describe challenges with management, resources, audience, technologies, etc.
Bartek Zarebski: We faced many challenges to overcome in order to affect these changes, including:
Lack of common structure of data
Lack of common definitions of business events among data sources
Lack of common understanding of the definitions in different departaments (editorial, financial, sales etc)
Lack of overall perception of entire value chain – silosing issue
Top management lacked digital experience, overall perception of the complexity of the value chain, expecting immediate business effects
There is only way to solve all these challenges: the best in class project management, engaging all contributors and all stakeholders, supported by agile culture managing expectations
Big Data & AI for Media: Please describe specific progress made with the project, such as increased revenue, engagement, audience growth, teamwork, subscription increase, etc.
Bartek Zarebski: We have achieved many positive effects from these data-driven changes, including:
Reduction of unnecessary page views by 30% (cost reduction)
Despite the page views reduction, the number of total ad inventory increased by +20%
Viewability of ad inventory increased by 25%-55% (depends on type of ad inventory)
Sell-out increased by 15 %
1PV gain more revenues by +20% average
What is the most important, nowadays we overdeliver the budget assumptions.
Big Data & AI for Media: Please identify long-term issues, such as plans for growth, change of technologies, projection for revenues or audience, impact on other projects, impact on company’s resources, management, strategy and/or resources.
Bartek Zarebski: Our next challenges are growth of eCPM, Time spent on content by users, and transformation from manual to automized content distribution in personalized way. We believe that these factors will support our business KPIs the most.
We also aim to centralize our data management competencies BUT decentralize our insights detection and its business implementation.
Big Data & AI for Media: Can you summarize your recommendations for other media companies hoping to duplicate your success and avoid challenges you may have faced?
Bartek Zarebski: Such a project requires a cross -functional core team composed of members of different departments of the company.
Before you start, make sure that the goal and reasons are clear for all participants and top management.
Support of top management is neccessary.
This is a cultural change for the media company, not only KPIs.
Enter the 2018 BIGGIES EMEA competition, with 12 categories focused on Big Data- and AI-driven products and processes at media companies. Deadline is Sept. 7. Enter now!
Mather Economics Listener Intelligent Paywall won a first place in the best in data-driven technology in the Global BIGGIES Awards competition.
Big Data & AI for Media:
Define the problem to be solved or technology disruption to be addressed
Arvid Tchivzhel:
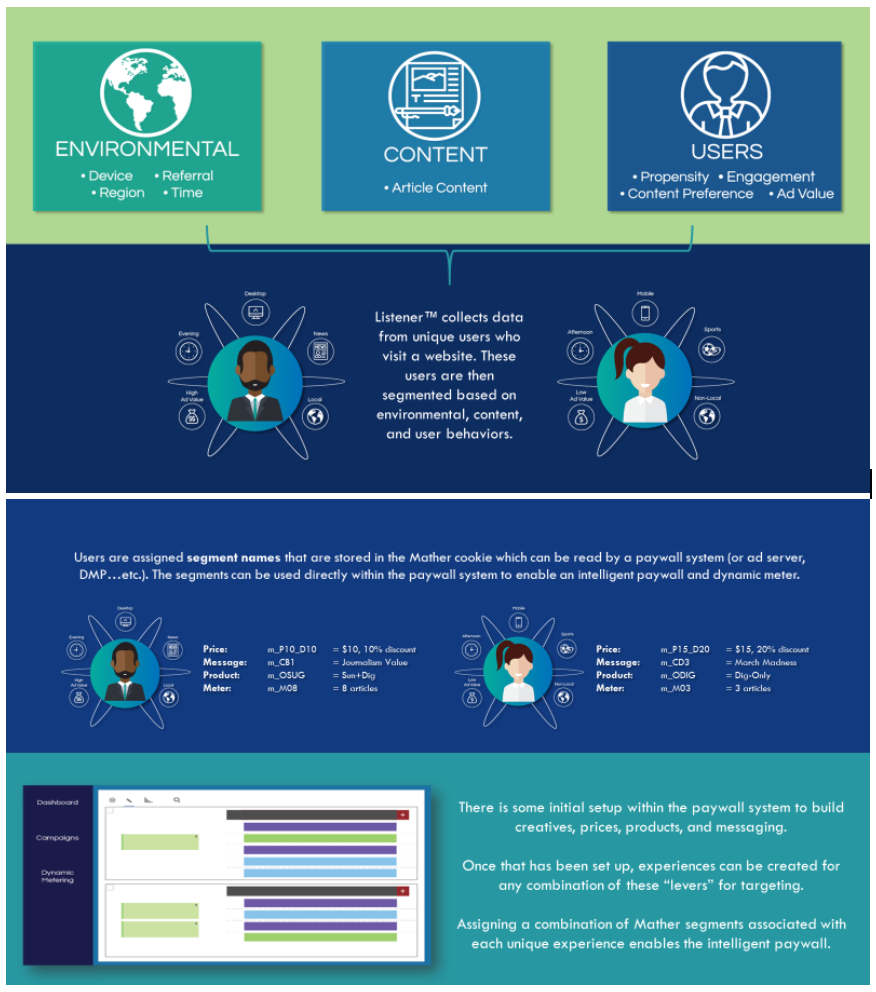
To help newspaper and media companies transform into the digital age, we developed the Listener™ data platform. Listener is the foundation that collects data from online audience, ad servers, payment platforms, other online interactions (like commenting engines, login systems…etc.) and offline data sources (such as demographics, subscriber payment history, newsletter usage…etc.). What makes our data collection unique is the granularity of data collection and ability to connect all the user interactions from dozens of platforms used by media companies. This removes data silos and eliminates the need to install multiple tracking tools that slow down site performance. We have submitted a patent in 2017 on the technology, design, and methodology of the data platform.
A robust data foundation is the first requirement to help publishers transition to advanced audience and content analytics in the digital age. We had attempted to utilize other tracking tools and widely-used dashboards but found limitations which did not provide a sufficient 360 customer view to address essential analytical questions, and more importantly, the ability to execute recommendations based on the analytics in real time. Thus, the Listener infrastructure not only collects data to build holistic datasets for analysis but also enables users to apply recommendations with direct integration into fulfillment tools such as email service providers, paywalls, data management platforms, and ad servers.
We built the Intelligent Paywall™ algorithm on top of the Listener data platform to solve one of the most critical questions for media companies. As many newspapers struggle to offset losses from their print subscribers and advertising and find challenges with declining CPMs in digital advertising, the need for a sustainable paid digital subscription business is apparent. However, publishers must balance the paywall configuration to limit potential advertising risk while still converting enough anonymous users to paid subscribers. Without a clear understanding of the tradeoff on a per-user-basis, publishers are “leaving money on the table” when applying a one-size-fits-all paywall. The Intelligent Paywall triggers the optimal user experience where net revenue is maximized. Media companies have multiple levers that can be adjusted to maximize net revenue. Levers available to publishers are:
The timing of the call to action (commonly referred to as meter setting);
The content used to encourage a call to action (what articles should be “behind” the paywall or accessible for free);
The price and discount being offered to incentivize the user to take action;
The product offered (digital-only, print+digital, or simply a free registration or newsletter signup in exchange for more content access);
The messaging and the creative proposed to the user (for example, focusing the value proposition on quality journalism, exclusive sports coverage, or community engagement based upon user preferences and behavior).
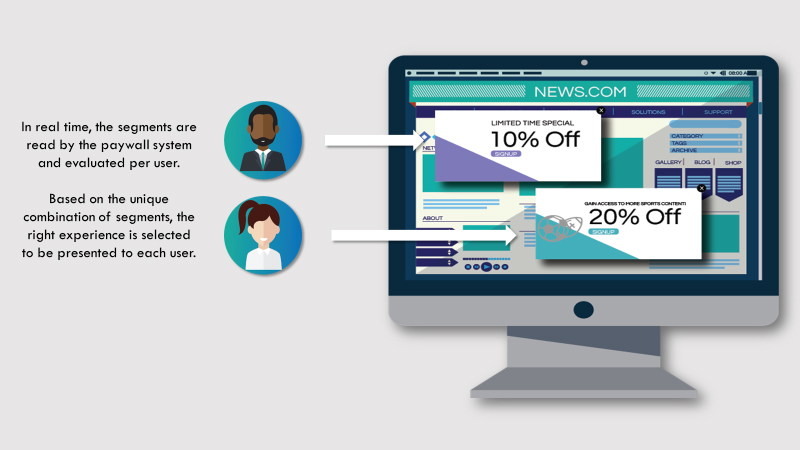
Knowing which user should be offered the right combination of these levers is the future of sustainable data-driven audience development and acquisition strategy. The Intelligent Paywall assigns each user the right combination of these levers to save advertising revenue and grow incremental subscription revenue in real time.
In summary, the Listener data platform solves the data capture and implementation problem while the Intelligent Paywall solves the analytical and business problem.
Big Data & AI for Media:
Describe time frame for project, and milestones that took place, details on planning, testing, experiments, rollout, review, improvements
Arvid Tchivzhel:
Listener and the intelligent paywall are the culmination of four years of ongoing development in collaboration with multiple publishers. Key milestones for the Listener data platform include:
Standardization of Listener configuration with publisher content management systems and data layers. Most paywall systems, ad servers, authentication systems, commenting engines, e-editions, and email systems are now supported or require minimal development resources.
Software development kits for Android and iOS platforms to apply the same principles and intelligence to mobile apps.
Deployment of Listener Tag Manager to simplify and expedite client onboarding with all the above. LTM has reduced onboarding and maintenance significantly allowing us scale most of the custom JavaScript development for each new publisher.
Quality control and standardization of all data definitions and pipelines. The “downstream processing” of the data captured by LTM transforms raw unstructured data into usable tables and metrics for reporting and analytics.
Setup of infrastructure to deliver recommendations into fulfillment systems. This is the piece of the puzzle to connect the data and analytics into the fulfillment engines common to publishers. The Listener Data Platform delivers recommendations at a user level into email systems, paywalls, ad servers, data management platforms, retargeting engines and almost any marketing fulfillment tool available to publishers.
Key milestones for the intelligent paywall include:
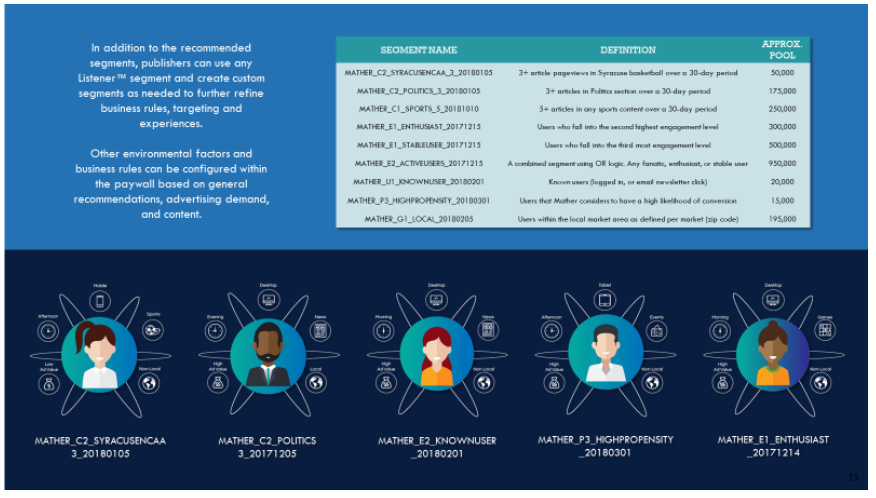
Development of the User Database – an internal processing and analytics engine to build user profiles, engagement metrics, and custom user segments (for example: sports fan, politics fan, engagement level, cart abandoner…etc.). Almost two years of development have been invested to build a robust user segmentation engine which continues to be refined with additional features and functionality.
Over one year has been invested to develop a conversion propensity model. The model uses discrete choice and clustering methodology to identify users who are likely to pay for content. This model is part of the core of the Intelligent Paywall segmentation and recommendation engine.
Currently, the team is working with multiple publishers to test the Intelligent Paywall and measure the impact of various levers to maximize user value. After testing, the Intelligent Paywall algorithm will be adjusted based on actual results.
Future milestones are to improve the propensity modeling and intelligent paywall algorithms using machine learning techniques to further improve predictive power.
Big Data & AI for Media:
Describe the resources used for the project, including budget, technologies, team members, skill sets, time spent
Arvid Tchivzhel:
Significant investment in capital and acquisition of talent were completed over four years and are ongoing to refine and scale the data platform and analytics. Key technologies that are utilized include:
Setup and configuration of a robust content delivery network to capture over 20 terabytes of new data each month with a 30% growth rate year-over-year utilizing Amazon and Google cloud services.
JavaScript code and a proprietary tagging engine (Listener Tag Manager) to configure site-specific data capture.
S3 buckets in Amazon Web Services to store unstructured raw data.
A Java-based ingestion process to transfer unstructured data into semi-structured tables in a distributed Hadoop file system (HDFS).
Utilization of a variety of coding languages to structure and process/automate data into usable datasets, analytics, and dashboards such as Bash, Stata, Python, Hive, Spark, PySpark, Pig, Oozie, MYSQL, and Tableau.
Github to manage the codebase and maintain version control.
The collective toolkit noted above has been implemented by a mix of data scientists, economists, developers, and data engineers. The team members involved have grown from a handful of economists to dozens of team members involved in various aspects of the product.
Big Data & AI for Media:
Describe challenges with management, resources, audience, technologies, etc.
Arvid Tchivzhel:
The primary challenge has been the alignment of distinct departments and stakeholders to test and execute the technology and analytics end-to-end. Most publishers are still evolving their organizational structure to catch up to the rapid pace of applying data science in the media industry and developing efficient workflows between key stakeholders and departments.
Onboarding often requires coordination between web developers, paywall vendors, authentication systems, and advertising operations. Often there are multiple stakeholders within each of these functions who must be engaged and aligned.
Publishers also have overlap between departments who are responsible for audience development, newsletter strategy, registration, digital subscriptions, and marketing automation/execution. Though a single department may be responsible for digital subscription revenue, implementing the Intelligent Paywall still requires considerable project management and coordination from within the organization to combine functional roles who have finite tactical goals under a single strategic umbrella. Incentives for one distinct operating group may be indirectly affected by others which also may prevent willing teamwork towards a broader goal. Thus, marketing, audience acquisition, audience engagement, and audience retention must be coordinated to ensure the successful implementation of the Intelligent Paywall and a holistic customer lifecycle management strategy.
Reporting hierarchies may also be vague which lead to perpetual deferment of decision-making and accountability of project success. The workflows between marketing, technology, and analytics to meet business goals is still elusive for many publishers.
Big Data & AI for Media:
Describe specific progress made with the project, such as increased revenue, engagement, audience growth, teamwork, subscription increase, etc.
Arvid Tchivzhel:
When applied to a known user base (users who have already registered for online access but have not yet paid for a product), the Intelligent Paywall targeted a select audience that generated a 0.34% conversion rate. A randomly sampled audience of the same size generated a conversion rate of 0.10%. The targeted audience by the Intelligent Paywall returned over 3X the revenue compared to the randomly sampled control group. Though not part of the test, the audience deemed “low propensity” would be left unaffected by any paywall tactics which enables them to continue browsing and generating advertising revenue. Though the revenue saved is difficult to measure, it is expected any page views beyond a meter setting of 5 (the meter at the tested media company) read by the “low propensity” group would have been lost without the Intelligent Paywall. Another test was implemented using the algorithm from the Intelligent Paywall but was integrated into an advertising server (DoubleClick for Publishers). The randomly sampled “Run of Site” group showed a conversion rate of 0.02% while the Mather High-Propensity audience showed a conversion rate of 0.04%. The conversion rates overall were low since the targeting was in an ad position rather than dedicated paywall lightbox but still returned 2X the value for a Sunday+Digital $1 offer. Additional testing across multiple publishers has proven the reliability of the propensity model in 2018. We have proven that the audiences identified as “high propensity” by the Intelligent Paywall convert 2-3X greater (including 2-3X the revenue) than a randomly sampled audience across multiple sites of varying sizes and regions. This has enabled publishers to ensure they don’t restrict content to users who are not going to subscribe (thereby not risking their ad revenue) and only offer the paywall to users who are likely to subscribe (getting the same or greater conversion volume than an across-the-board approach and limiting the advertising risk).
The project has evolved to test the application of different levers (outlined above) to the high, medium and low propensity audiences. Multiple publishers are launching A/B testing to measure the impact of different meter settings, messaging, product offering and other characteristics. We are eager to see results this year.
Big Data & AI for Media:
Identify any long-term issues, such as plans for growth, change of technologies, projection for revenues or audience, impact on other projects, impact on company’s resources, management, strategy and/or resources.
Arvid Tchivzhel:
There are long term challenges to consider:
Open source technology is changing at a rapid pace and requires a unique skillset to manage. Data engineers must keep abreast of new tools, methods, and emerging languages that are being used. However, they must also be thorough in evaluating if new technologies are short-term fads or if they will become mainstays in Big Data. One such example is Pig, which had a surge of activity several years ago but is now not attracting many submissions to maintaining this language. Spark is an example of a technology that has become a mainstay after some debate within the community about its viability as a standalone technology.
The media industry continues to transform and adapt to new technologies like virtual reality as well as constantly deciding what platforms to embrace or shun. Facebook Instant Articles, Twitter, Instagram, and Google are vying for valuable content and have built-in audiences. Publishers will dictate how large of a role these platform providers will play in relevance and revenue. We must be ready to integrate and adapt Listener and the Intelligent Paywall to the direction of the industry but also be wary of short-term enthusiasms as publishers search for new revenue sources in the digital age.
Big Data & AI for Media:
Summary of recommendations for duplicating success and avoiding challenges for other media companies
Arvid Tchivzhel:
There are several lessons learned over the last four years:
Publishers should pick the right vendors who can execute a user-specific strategy. Email systems and paywall systems have different features and functionality so finding technology that can execute user-level personalization is important.
We have seen only the largest and most advanced publishers with significant resources and national audiences be able to build the data, modeling, and execution with internal resources. Metro, medium and smaller publishers should look to partners who can provide some or all parts of the toolkit required to replicate the success from larger publishers.
Reporting key performance metrics should be measured holistically. Often publishers are focused on a singular metric (for example, online conversions) so may forget about the importance of nurturing and engaging audiences first as well as measuring success across multiple channels such as email and referrals. For example, capturing a significant volume of email addresses via newsletters and then remarketing directly via email with subscription offers may not improve on-site conversion rates but is a stronger audience development strategy.
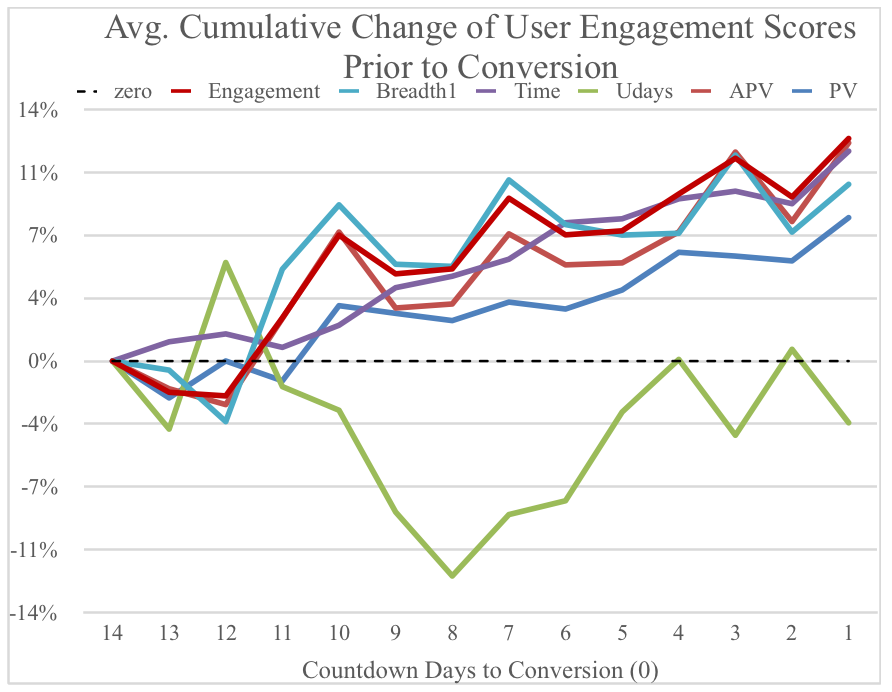
Almost all user engagement metrics show acceleration about two weeks prior to the conversion event. The propensity model underlying the Intelligent Paywall models this acceleration and identifies users who exhibit this type of behavior.
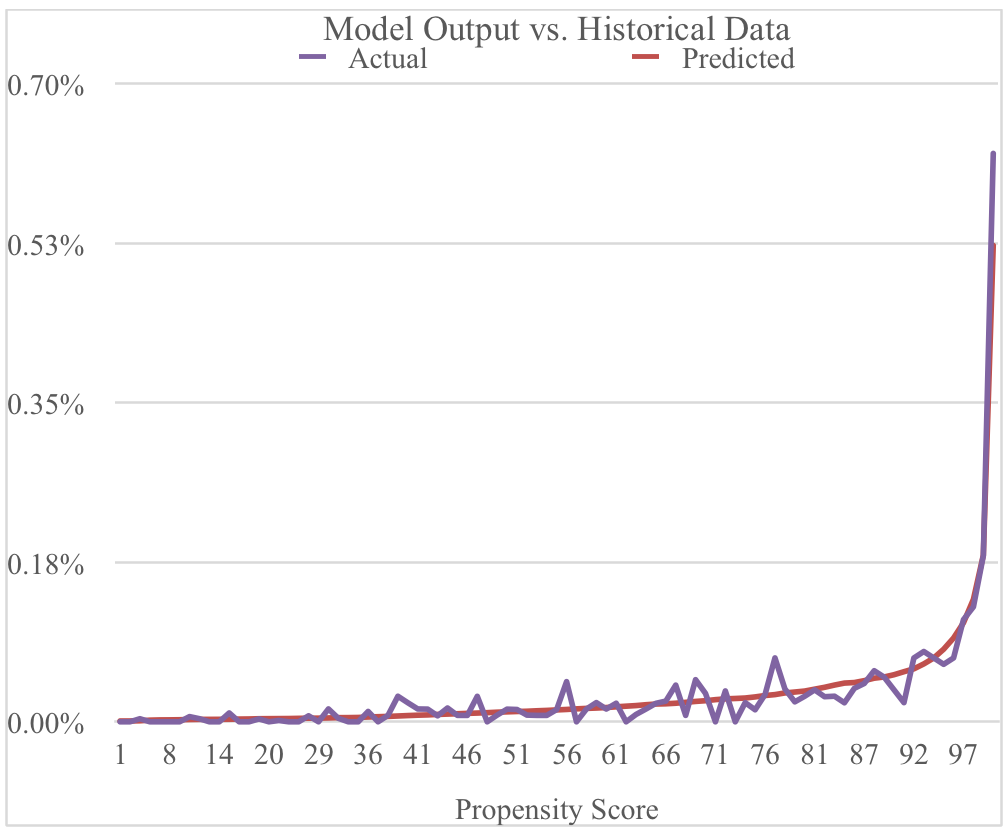
Propensity model shows strong correlation with actual historical data. Users with a score greater than 90 show an inflection point of conversion propensity. These users are combined into a high propensity segment for targeting specific marketing messages. Users with scores below 40 show low propensity and are unlikely to pay for content. Users with scores between 40-90 show moderate conversion propensity so may not be ready to pay for content but may be open for free registration or newsletter signup.
Enter the 2018 BIGGIES EMEA competition, with 12 categories focused on Big Data- and AI-driven products and processes at media companies. Deadline is Sept. 7. Enter now!
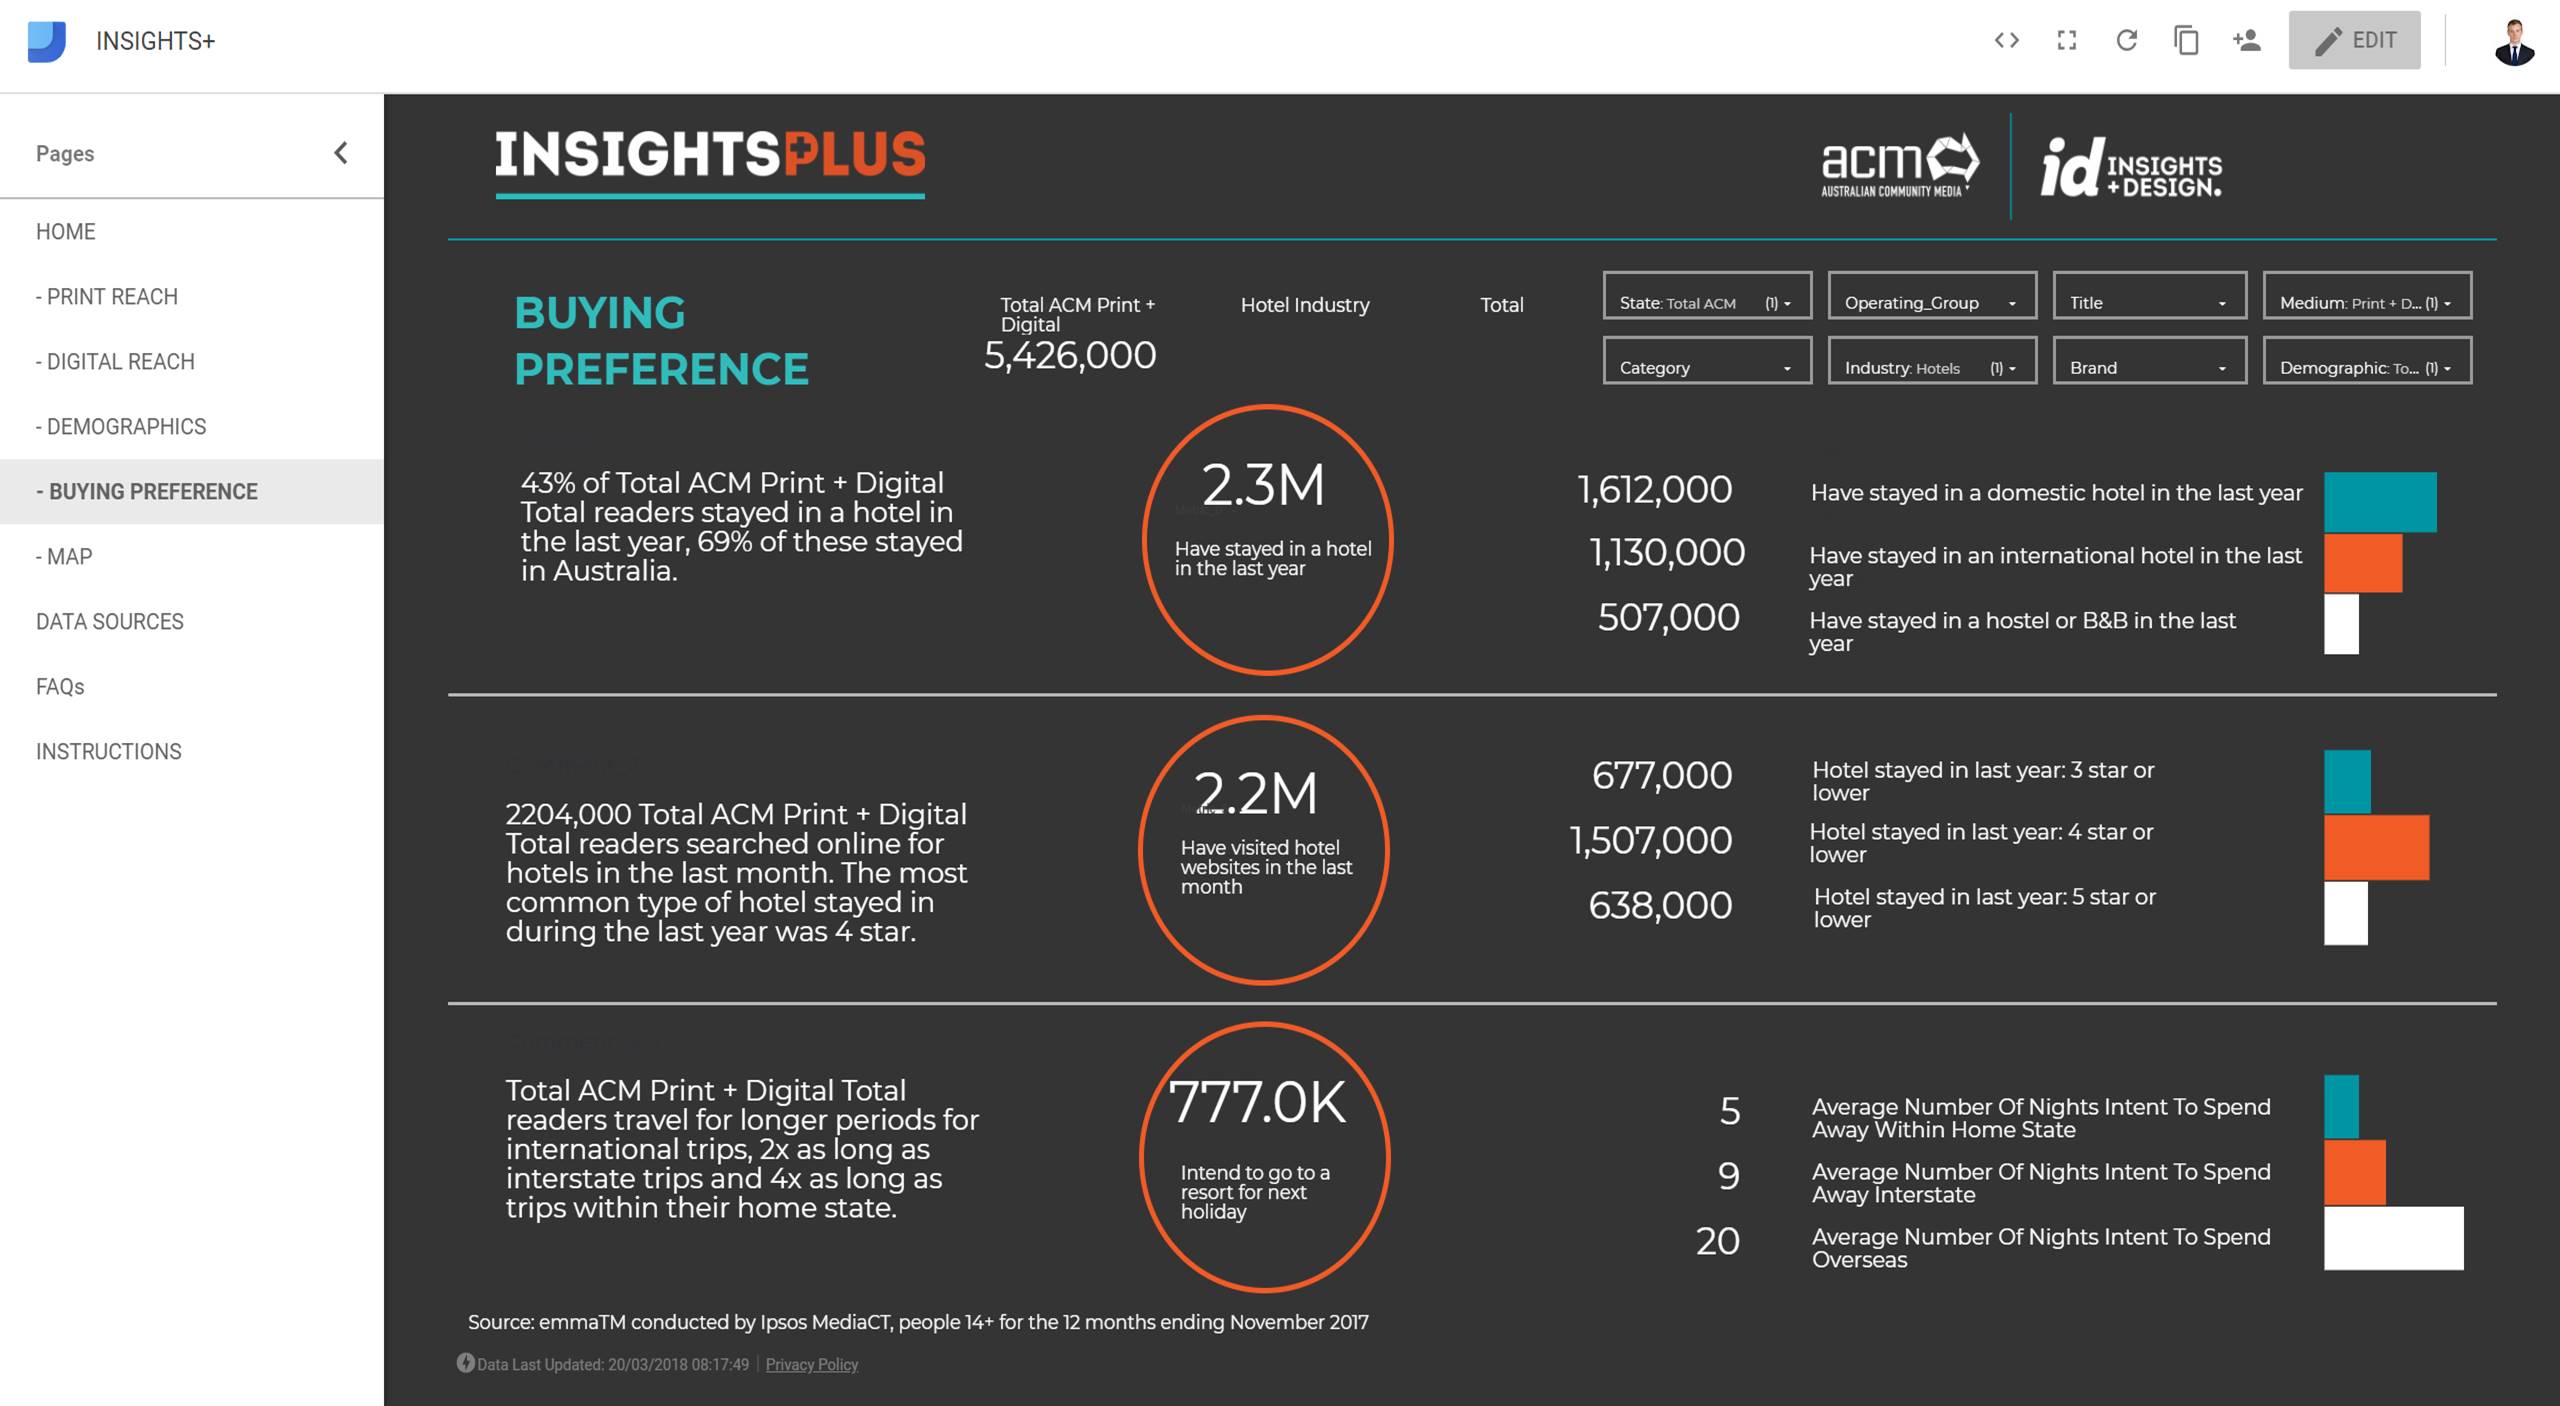
Australian Community Media (ACM) is the regional news and content publishing division of Fairfax Media. It has a network of over 600 sales people, admin and managers who require up to date audience information for each of the 200 news brands they own and additional 100 they represent. Each news brand can have thousands of individual clients each year. Sales offices are distributed over every state in Australia without a centralised distributor of sales collateral.
Providing sales collateral based on research has historically been a difficult task. Audience metrics for print are provided by Ipsos (through emmatm), digital metrics by Nielsen or Google Analytics and demographic metrics by census data (ABS). Because of the number of different data sources; provision of research was previously conducted by one analyst who provided ad hoc research to sales reps servicing the largest clients, the remaining sales reps did not receive data-driven sales collateral.
It quickly became apparent that rather than creating ad hoc reports for hundreds of sales reps it would be more efficient to create a self-service business intelligence platform that contained audience research data. The platform can then be used as a single source of truth for audience data by the entire business unit. Each page on the BI platform contained data from a different source, available data includes: print and digital reach, demographics, web analytics, audience buying preference and maps of distribution areas. On each page users are able to select which title they are representing and their desired metrics.
This project was completed by one analyst over the course of a year with no additional cost to the business, all tools and data used were either free or already in use within the business. Given that this was a solo project the planning process was extremely agile. Significant milestones included pitching a MVP to management in February 2017, soft launching in September 2017 and hard launching in February 2018. The data inputs for the platform are 3rd party sources meaning that they don’t integrate directly so the entire ETL process has to be completed manually. Data is exported into csv, transformed in excel then loaded into Google Cloud Storage, Big Query then Data Studio. With the exception of exporting 3rd party data into excel the entire process uses Google products in order to utilise the big data capabilities of Big Query and data visualisation of Data Studio. These tools also had the benefit of being free and integrating with the business due to the use of G-Suite and Google Chrome by members of the business.
Sales reps can view audience buying preferences for over 50 different industries and 350 Australian brands, this data is available for 200 newspapers and websites or combinations of both. This results in over 200,000 different combinations of brands/industries and newspapers and news sites. Each page is designed to be a stand-alone sales argument and the data is accompanied by Natural Language Generation insights which aid the salesperson in explaining the research to the client. This NLG functionality was built in during the ETL process before being loaded into Big Query.
The platform was soft launched in September 2017 to a select group of sales managers within the organisation. These early adopters were used to gather feedback before launching in February 2018 at an internal conference. Early feedback was instrumental in improving user experience and also highlighted the need to educate users on how to effectively use insights to sell. Users were educated through a combination of small group demonstrations, a conference presentation to 100 stakeholders and live-streaming a video demonstration to hundreds of stakeholders. Early learnings during this feedback period demonstrated that salespeople were copying data from the platform and pasting it into their existing sales decks. The next phase of the project will be to create an end-to-end solution using the same design principles in which salespeople are provided with a finished sales deck.
The platform is online and can be accessed through a link. Users reach this link through the company’s internal social media platform (Facebook Workplace), uptake of the platform was viral as early adopters of the platform then shared the link with an average of 5 co-workers. Data security is managed through Google, because Data Studio is a Google product all new users have to individually request access from the document owner. This allows the owner to prevent the platform being shared outside of the company and also track individual usage.
User activity is measured through Google Analytics, during beta stage there were 50 monthly users, on launch this increased to 80 users on day one and 350 monthly users following adoption. Originally it was assumed that salespeople would use their iPads to access the program and the dashboards were optimised for iPad, this assumption turned out to be incorrect as 97% of usage is through desktop computers. This insight aided in optimising the product for an easier user experience. User behaviour within the platform is also tracked by analysing queries to the underlying Big Query database. This allows analysis of metrics and newspapers selected by sales reps when pitching to clients, this informs product management decisions as popular industries such as real estate can be expanded on.
Feedback from salespeople indicates that insights from the platform have contributed directly to generating new revenue. Additionally, sales people now have more time to sell rather than search for information to put into pitching decks so the platform has saved a significant amount of time for salespeople and marketing managers. Prior to the launch of the platform; audience insights were transmitted in static documents via email, this was time consuming and resulted in out-of-date information being used throughout the business. The business has benefitted from the existence of a single source of truth as the data is always accurate and always up to date. The platform is now seeing adoption in business units outside of sales as its insights have been quoted by journalists in ACM publications. The platform has also gained success on the international awards circuit as it came first in the BIGGIES Global – Excellence in Business Process Efficiency category and is currently a finalist in INMA Awards categories for Audience Research and Data Analytics.
The project is sustainable long-term as the data processing runs on Google Cloud meaning that it is scalable to our needs and costs to expand functionality will be variable. The current project is unifying all disparate sources of data into a data warehouse which would be accessible to users via InsightsPlus. A key learning of this project has been that all data sources need to be transferred into the cloud using APIs as quickly as possible and there are significant benefits to maintaining all data flows and storage on the same IaaS platform (in this case Google Cloud Platform).

 But there is more to gain from using United Robot’s analysis and natural language platform.